During the last year, it has emerged a long
term trend of the global energy demand and supply. The global energy
consumption has further slowed down; meanwhile, the energy structure has been
going through a transition to low-carbon pattern.
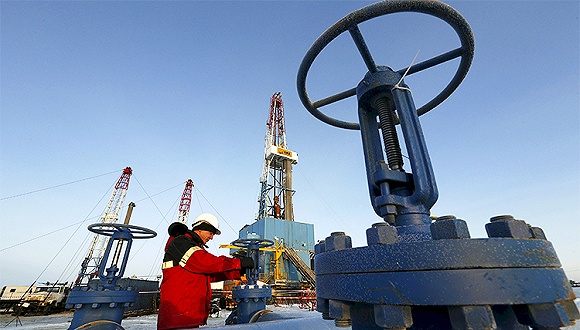
On 7 July, the BP Statistical Yearbook of
World Energy (Chinese Version) (hereafter called Yearbook), with 65 years of
publishing history, released its latest version in Beijing.
Global Primary Energy Demand has Only
Increase by 1%
According to the Yearbook, the global
primary energy demand has only increased by 1% in 2015, which was quite near to
the 1.1% of 2014, but far lower than the 1.9% of the average increase of the
past 10 years.
This has been the lowest year-growth-rate
since 1998 apart from the recession of 2009. According to the Yearbook, the
reasons for China’s slow-growth of energy consumption were the continually weak
global economy and economic transition from industrial-based economy to
service-oriented economy. In 2015, the energy consumption increase of China,
which was 1.5%, hit the bottom among all those years since 1998, while average growth
rate of the past 10 years was 5.3%.
First Increase of Oil Market Share Since
1999
According to the Yearbook, oil remains the
main fuel all over the globe. In 2015, oil accounted for 32.9% of the global
energy consumption, which was the first increase in terms of the market share
since 1999.
In terms of crude oil price, the spot
average price of Brent oil of 2015, which turned to be the lowest annually
average price since the year of 2004, was USD52.39 per barrels, which was 46.56
lower than that of 2014. The major reason for the oil price slump at the end of
2015 was that the OPEC countries, especially Iraq and Saudi Arabia, hugely
increased their oil output.
In terms of oil consumption volume, the
global oil consumption has increased by 1.9 million barrels (1.9%) per day last
year, which was almost as twice as the recent historical averages (1%) and far
higher than that of 2014 (1.1million barrels per day).
In terms of oil refining, although the
outputs of Central and South America, Africa, and Russia have decreased, the
global crude oil processing volume of last year increased by 1.8 million barrels
per day, with the year-on-year growth of 2.3%--as three times as the average
increase of the past 10 years. On the contrary, the global refining capacity
just increased by 450,000 barrels per day -- the smallest increase among the
past 23 consecutive years.
In terms of oil reserves, the world’s
proven oil reserves decreased by 2.4 billion barrels to 1.6976 trillion barrels
in 2015. According to BP, this was the second time that they found the decline
in the global proven reserves based on their database since the first reserve
decrease of 1998. However, in the past 10 years, the proven oil reserves all
over the globe increased by 24%, which means 320 billion barrels that would
support the global production for 50.7 years.
Proportion of Natural Gas in Primary
Energy Consumption Increased to 23.8%
According to the Yearbook, the global
natural gas consumption increased by 1.7% in 2015, which was 0.6% higher than
that of 2014, but still lower than 2.3%, the average growth of the past decade.
Up to the end of 2015, the natural gas accounted for 23.8% of the primary
energy consumption.
In terms of output, the global natural gas
increased by 2.2%, which was faster than the consumption growth. The United
States gained the largest increment by the growth of 5.4%, while the output of
the Europe Union plummeted.
In terms of the trade of natural gas, the
global natural gas trade rebounded in 2015 with the increase of 3.3%, among
which the liquefied natural gas increased by 1.8%. Internationally, the trade
volume of natural gas has taken up 30.1% of the total trade volume. And among
the natural gas trade, the proportion of the pipeline gas has increased to
67.5%.
Global Coal Demand Encountered with Biggest
Decline
According to the Yearbook, the global coal
consumption decreased by 1.8% in 2015, far lower than the average growth rate
of the past 10 years (2.1%). BP proved that this was the biggest decline based
on their database. The proportion of the coal to the global primary energy
consumption, which was deemed as the record low since 2005, decreased to 29.2%.
All the net decrease of coal consumption were caused by the US and China.
In terms of the output, the global output
of coal reduced by 4%, among which the US, Indonesia, and China encountered
huge reduction in production. The coal output of the US, Indonesia and China
respectively decreased by 10.4%, 14.4%, and 2%.
Growth
in global nuclear energy generation all were contributed by China
According to the Yearbook, the global
nuclear energy generation increased by 1.3% last year, among which almost all
the growth were contributed by China. Up to the end of 2015, the nuclear energy
taken up 4.4% of the global primary energy consumption. And China surpassed
South Korea as the top four in terms of the nuclear energy generation with
output increased by 28.7% on year-on-year basis last year.
China Remains the Largest Producer All
Over the Globe
In terms of the hydroelectricity, the
global hydropower capacity increased by 1% last year, lower than the average of
the last 10 years (3%). Up to 2015, the hydroelectricity accounted for 6.8% of
the global primary energy consumption.
China remains to be the largest producer of
hydroelectricity all over the world with the increase of generating capacity of
5%. Although the growth rate was less than the half of the historical average,
almost all the net increase of global hydroelectricity were all contributed by
China. Moreover, the hydroelectricity generation was greatly increased in
Turkey and Scandinavia, but declined in Italy, Spain, Portugal, and Brazil.
China Surpassed Germany and the US to be
Top 1 in terms of Solar Electrical Energy Generation
In terms of the renewable energy, according
to the Yearbook, the renewable energy has taken up 2.8% of the global energy
consumption, higher than that of 10 years ago (0.8%). The output of the
renewable energy generation increased by 15.2%, a little bit lower than the
average of that in the last 10 years (15.9%). Up to the end of 2015, the
renewable energy accounted for 6.7% of the global power generation.
China has surpassed Germany and the US to
be top 1 in terms of solar electrical energy generation. The global solar power
generation increased by 32.6%, among which China ranked the first with the
increase of 69.7% followed by Japan and the US.
Wind energy remains to be the largest
source for renewable energy generating all around the world with the proportion
of 52.2%; while the global output of bio-fuel only increased by 0.9%, much
lower than the average of the last decade (14.3%).
*This article is edited and
translated by CCM. The original article comes from jiemian.com.
About CCM:
CCM is the leading market
intelligence provider for China’s agriculture, chemicals, food &
ingredients and life science markets. Founded in 2001, CCM offers a range of
data and content solutions, from price and trade data to industry newsletters
and customized market research reports. Our clients include Monsanto, DuPont,
Shell, Bayer, and Syngenta. CCM is a brand of Kcomber Inc.
For more information about
CCM, please visit www.cnchemicals.com or
get in touch with us directly by emailing econtact@cnchemicals.com or calling
+86-20-37616606.